Lab 3: Operational Management of Amazon ES
In the previous Lab, you have been trying out with the basics of using Kibana, such as creating and analyzing visuals of Kibana In this lab, you will try out with some operational managements, such as permission management, alerts, and index management.
Section 1: Amazon ES Permissions Management
When you have set up Amazon ES in Lab 1 and logged in to Kibana, user authentication with a user name and password were required. In this lab, the master user account was used to login. However, a mere user can’t usually use the same master account to perform analyses in Kibana. The correct method is to create a separate account for each user and grant only limited permissions that match the user’s role.
So in this section, it assumes that you are a user of the IoT department and publish the dashboard you have created to those users. In addition, among users of the IoT department, you will separate their permission between developers with write permission and viewers with read-only permission, and set a content boundary for each of them.
Creating tenants and copying data
First, you will create a space to open only to users of the IoT department in Kibana. Amazon ES uses the concept of tenants which is the scope to publish to a limited number of people. By default, there are Private tenants that only the user who created them can access, and Global tenants that are shared by all users. Let’s add new tenants here for the IoT department.
- Click
 icon on the left of the screen to open the menu to set security.
 - Click [Tenants] under “Permissions and Roles” to go to the screen to edit tenants. Then, click [+ button] on the right of the screen to create a new tenant.
- Enter “IoT” in “Tenant name”, and click [Submit].
Next, export existing index patterns, visuals, and dashboard data.
- Click
 icon in the left menu to open the Management screen, and then click [Saved Objects] in the left.
 - A list of index patterns, visuals, and dashboards created in Lab 2 are displayed on the screen. Check all of these items, and click [Export] in the top right. A JSON file containing these settings will be downloaded.
Then, switch the tenant and copy the data.
- Click
 icon on the left of the screen to open the tenant settings menu. Then, click [Select] for the IoT tenant to switch between tenants.
 - Click icon in the left menu to open the Management screen, and then click [Saved Objects] in the left.
- Click [Import] button in the top right of the screen to choose the JSON file in the above and upload it. The dashboard and visuals mentioned in the earlier are now copied to your screen.
Creating a new Amazon ES role
Now, you will create a role that is set of Amazon ES permissions to assign to users for the IoT department. The two types of roles will be created here for developers with write permission and for viewers with read-only permission. First, create a role for developers.
- Click icon on the left of the screen to open the security settings menu.
- Click [Roles] under “Permissions and Roles” to go to the role management screen, and click [+] button to open the new role creation menu.
- Enter “iot_developer_role” in “Role name”.
- Choose [index Permissions] tab at the top to open the cluster permissions settings menu, and click [+ Add index permissions] button. Enter “workshop-log-*" in “Index patterns”. Then, choose [crud] under Permissions: Action Groups.
- Choose [Tenant Permissions] tab in the top right, and click [Add tenant permissions]. Next, enter “IoT” in “Tenant patterns”. From the pull-down menu, choose [kibana_all_write] for “Permissions”. Then, click [Save Role Defintion] button to complete the role creation.
In a similar manner, create roles for viewers.
-
Click [+] button on the right of the role management screen.
-
Enter “iot_reader_role” in “Role name”.
-
Choose [index Permissions] tab at the top to open the menu to set permission of new cluster, and click [+ Add index permissions] button. Next, enter “workshop-log-*" in “Index patterns”. Choose [read] in “Permissions: Action Groups” below. Then, enter the following string for “Document Level Security Query”. This is an Elasticsearch query to display only workshop-log data which has OK in status field. At last, add “ipaddress” in “Anonymized fields”. The following shows the configuration.
{
  "bool": {
    "must": {
      "match": {
        "status": "OK"
      }
    }
  }
}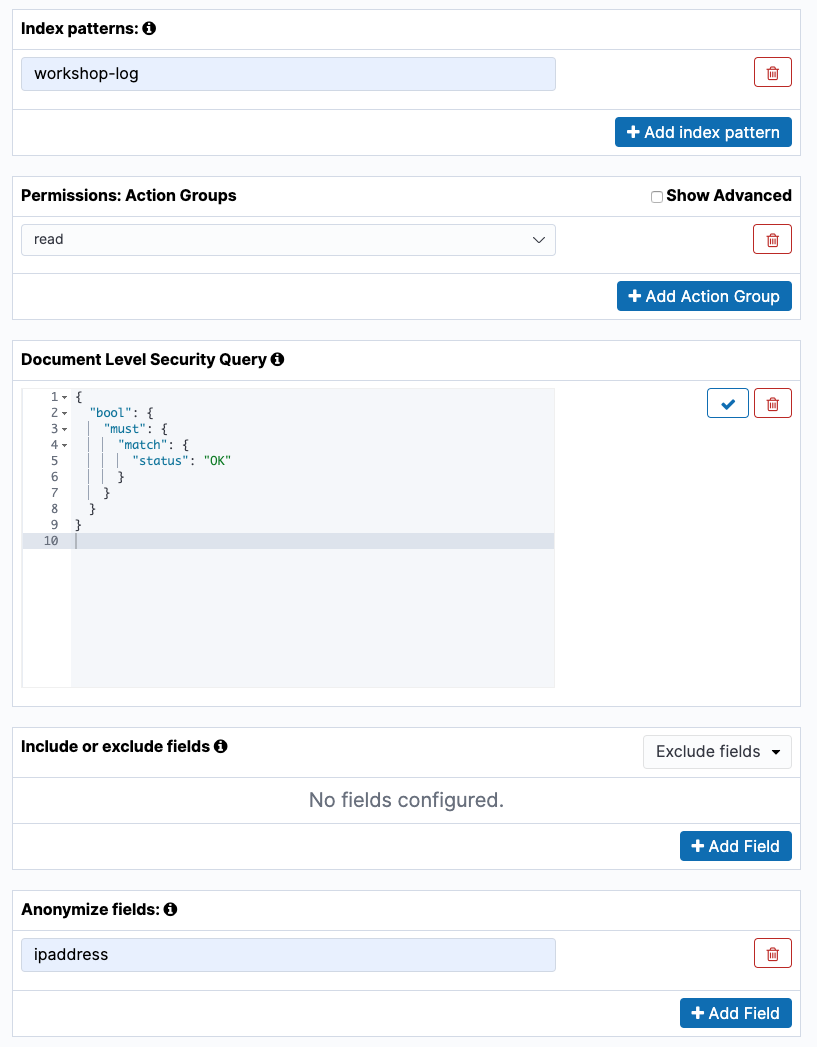
-
Choose [Tenant Permissions] tab at the top of the screen, and click [Add tenant permissions]. Next, enter “IoT” in “Tenant patterns”. Choose [kibana_all_read] from the pull-down menu of “Permissions”. Then, click [Save Role Defintion] button to complete to create the role.
Setting up Kibana users and mapping roles
Now, you will create a user to log in to Kibana.
- Click icon on the left of the screen to open the menu to set security.
- Click [Intenral User Database] button to go to the user management page. Next, click [+] button in the top right of the screen to open the new user creation screen. Enter “iot_developer” in “Username” and the appropriate string in “Password” and “Repeat Password”, and then click [Submit].
- In a similar manner, create browsing users as well. Click [+] button in the top right of the screen to open the new user creation screen. Enter “iot_reader” in “Username” and the appropriate string in “Password” and “Repeat Password”, and then click [Submit].
At last, associate the created user with the role you have prepared earlier.
- Click [Role Mappings] button from the top screen of the security settings.
- Click [+] button in the top right of the screen, and choose [iot_developer_role from] from the pull-down menu of “Role”. Then, enter the user name “iot_developer” you have created earlier into “Users”. At last, click [Submit] to complete the mapping.
- For the viewer, in a similar manner, click [+] button in the top right of the screen, and choose [iot_reader_role] from the pull-down menu of “Role”. Then, enter “iot_reader” in “Users”, and click [Submit] to complete the mapping.
- In addition, to use the Kibana UI, you must grant both developers and viewers a predefined kibana_user role on Amazon ES. Click [+] button in the top right of the screen, and choose [kibana_user] from the pull-down menu of “Role”. Then, enter “iot_developer” in “Users”, click [+ Add User] button to add “iot_reader”, and click [Submit].
Now, you have completed the tasks of tenants creation, roles and users creation and the mapping. Then, let’s try logging in as the user you have created, and then make sure that the permissions are working as expected.
Log in as the user you created and check the permissions
First, you will log in with iot_developer.
- Click the user name [awsuser] in the top right of the Kibana screen, and temporarily log out from Kibana. Go back to the login screen, and log in with the iot_developer account you have created.
- You can confirm that there is no icon in the left menu of the screen after logging in. The iot_deveoper user cannot access this menu because it does not have the administrator credential.
- Click icon on the left of the screen to open the tenant settings menu. Then, click [Select] for the IoT tenant to switch between tenants.
- Make sure you have access to such as Discover, Visualize, and Dashboards, and you can search and create visuals.
Next, you will try logging in with iot_reader.
- Click the user name [iot_developer] in the top right of the Kibana screen, and temporarily log out of Kibana. Go back to the login screen, and log in with the iot_reader account you have created.
- Click icon on the left of the screen to open the tenant settings menu. Then, click [Select] for the IoT tenant to switch between tenants.
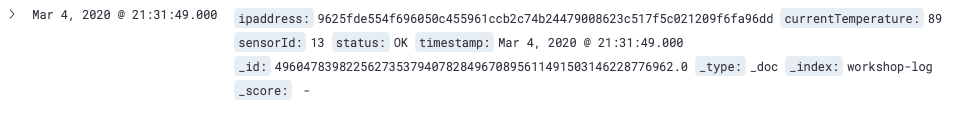
- Open the Discover page, adjust the time range of the target data appropriately, and display the data. You can see that the ip_address column is hashed as follows. This is because the ipaddress column was specified in the anonymized fields of iot_reader_role you have created earlier.
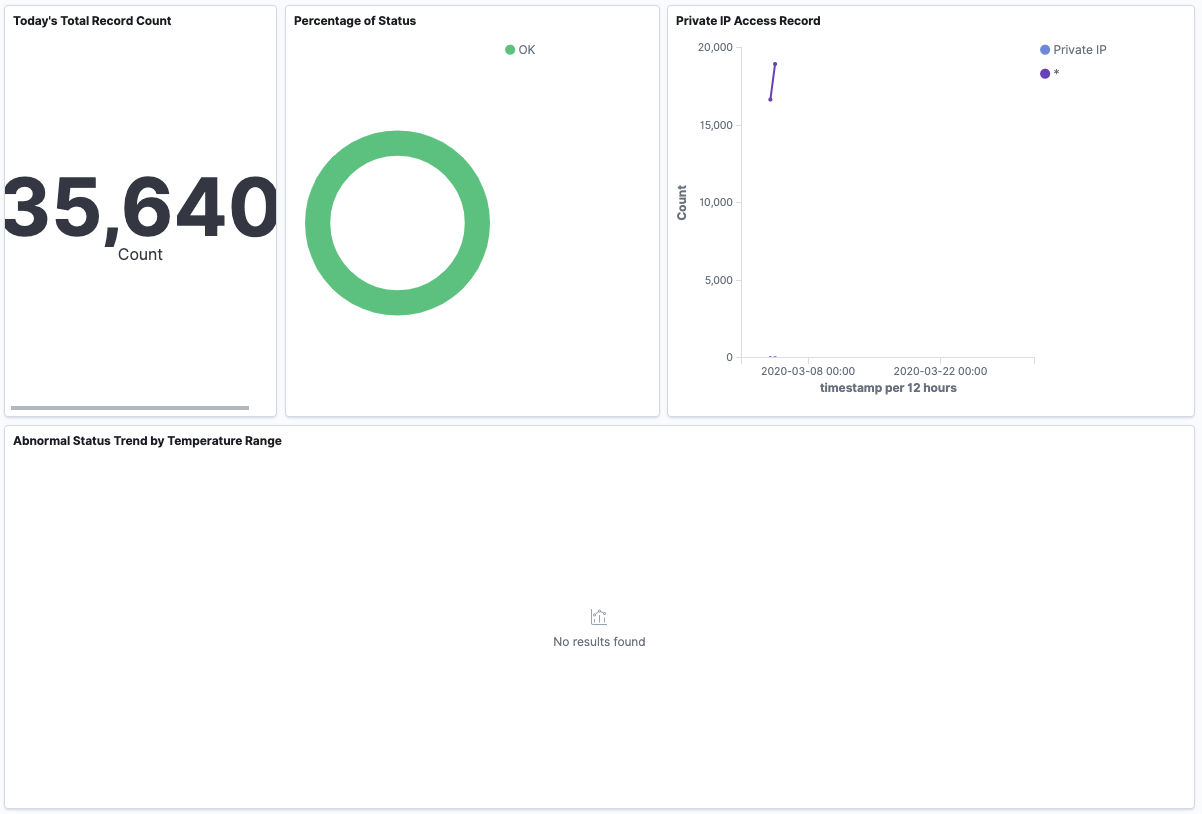
- Also, when you open the Dashboards page, you can see that “Percentage of Status” is OK as shown below. This is because it was set to be able to view only that the status column has OK. Also, because the IP address is hashed, Private IP and other time sequence transitions are not displayed in the graph.
Once you have completed this confirmation, log out of iot_reader, and then log back in to Kibana as the master user created in Lab1. It is mandatory to proceed with Section 2 or later.
Section 2: Sending Alerts to Amazon SNS
Amazon ES offers more functionality than just visualizing data using dashboards. When a certain data exceeds the predefined criteria, it can send the notification and prompt you to respond too. For example, if you are collecting logs from your equipments, you may want to send an alerting email to the administrator when the status of the error was recorded more than a predefined time. Therefore, let’s try to send the notification to the SNS topic set in Lab 1 here.
The mechanism of alerts on Amazon ES as follows. In this example, you will monitor the number of FAIL statuses in the log in the metric every minute. Here, if you receive more than one log with FAIL status in a minute, you can send an alert email via SNS topic as an action.

Destination Settings
First, set the destination of the action. Here, specify the SNS topic created in Lab 1 as the destination.
- Click
 icon on the left of the screen to open the Alerting menu.
 - Choose [Destinations] tab from the menu, and click [Add destination] button.
- Enter “Amazon ES alert topic” in “Name”. Choose [Amazon SNS] from the “Type” pull-down menu. Enter SNS topic you have created in Lab 1 and IAM role ARN to “SNS Topic ARN” and “IAM role ARN” in “Settings”.
- SNS Topic ARN: The string should be look like
arn:aws:sns:us-east-1:123456789012:amazon_es_alert - IAM role ARN: The string should be look like
arn:aws:iam::123456789012:role/amazones_sns_alert_role
- SNS Topic ARN: The string should be look like
- Click [Create] button.
Monitor Settings
Now, you will set the metrics and frequency for monitoring in the Monitor function. Here, you will count the number of FAIL in the status field in the log, once per minute.
- Click icon on the left of the screen to open the security settings menu.
- Choose [Monitors] tab from the menu, and click [Create monitor] button on the right.
- After opening the Monitor creation screen, enter “FAIL status monitor” in “Monitor name”. Then, enter “workshop-log-*" in “Index” within “Define monitor”, and choose [timestamp] as “Time field”. Then, set
WHEN count() OVER all documents FOR THE LAST 1 minute(s) WHERE status is FAILto the query of “Create a monitor for”. After setting it all, you can see as follows.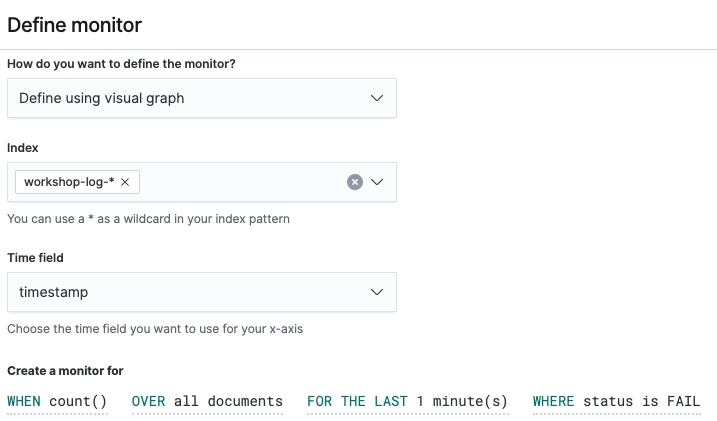
- Click [Create] button to create a Monitor. After creating a Monitor, move to the Trigger creation screen.
Trigger Settings
Now, you will set up Trigger. Here, you assume that you want to alert if there is more than one FAIL status.
-
Enter “FAIL count trigger” in “Trigger name”.Set [3] for “Severity level”. Then, set
IS ABOVE 1in “Trigger condition”.This triggers the alert when it is raised more than 1, that is 2 times. -
Go to “Configure actions” at the bottom. Enter “Too many FAIL notifications” in “Action name”. From the “Destination” pull-down menu, choose [Amazon ES alert topic - ( Amazon SNS)] you have created. Then set “The record number of FAIL status exceeds over that the threshold” to “Message subject”.
-
Replace “Message” with the following content by deleting the first message.
An alert was detected on the monitor item {{ctx.monitor.name}}.Please check the status. - Trigger: {{ctx.trigger.name}} - Severity: {{ctx.trigger.severity}} - Aggregation start time: {{ctx.periodStart}} - Aggregation end time: {{ctx.periodEnd}} -
Click [Create] button to create the Trigger.
Then, the setting for Trigger has been completed.
Reviewing Results
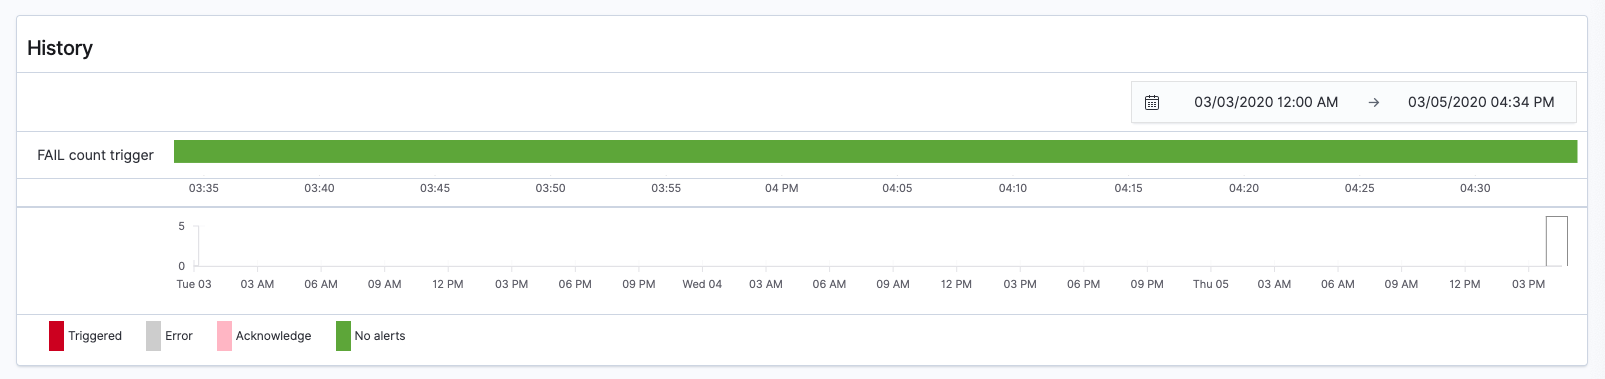
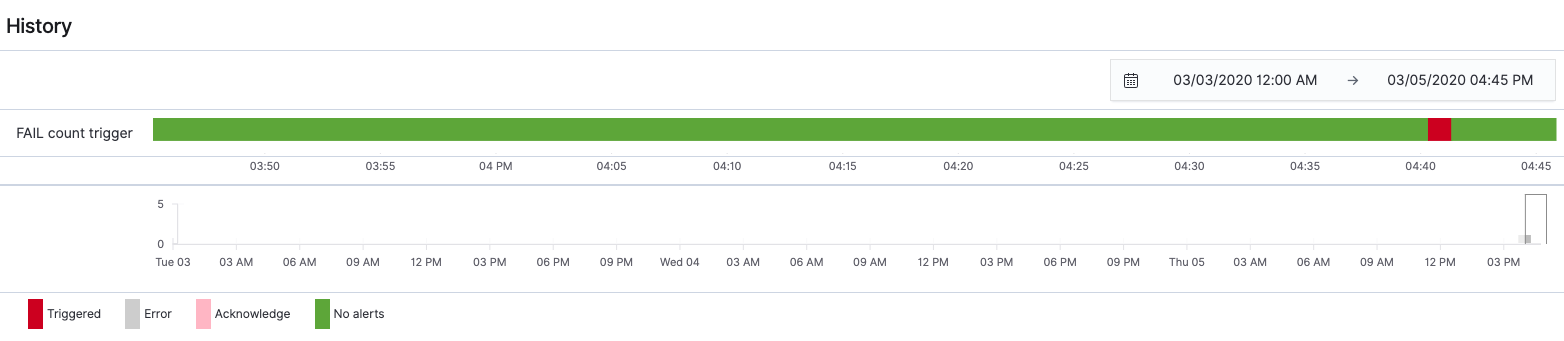
You can see that the history of the alert is displayed in History when you open the FAIL status monitor page.
After a few minutes, an alert message will be sent to the set email address and Triggered will be displayed in the alert history.
When alerting, the alert is displayed in the list on [Dashboard] tab. After checking the check box on the left, and you can stop the alert by clicking [Acknowledge] button. However, if a similar situation occurs, a new alert will be raised and emails will continue to be sent. So when you are completed reviewing, choose the check box for the created Monitor from [Monitors] tab, and click [Disable] in [Actions] button.
Section 3: Managing Index
As described in Lab 1 and Lab 2, Amazon ES data is basically managed by index units. In this workshop, when inserting logs from Firehose, the index name of the destination is changed periodically. In a log analysis use case like Lab 2, recent data is usually processed frequently. However stale data saved long time ago rarely get any access.
If a new index is created every hour like this lab, a large amount of disk space is demanded to store a large number of old indexes that rarely get access. Naturally, old index are configured to deleted automatically. Also, if large amount of access hit a server, the index size may increase. This may affect the performance of the analysis. In such case, you can create a new index automatically when it exceeds a certain size. And writing to the new index would be stable the operation of Amazon ES.
Amazon ES has Index State Management feature which enables sthe index management as described. Now, let’s apply a setting that automatically deletes the log after 7 days after the index is generated.
Creating Index Policy
The JSON format configuration file describing the operation rules is called index policy in Amazon ES. You will create an index policy that automatically deletes the index in 7 days passed after the index is created. To make sure the policy will be applied to indices that will be created in the future, you add an index pattern to the policy.
-
Click
 icon on the left of the screen to open the Index Management menu.
 -
Choose [index policies] menu from the left menu, and click [Create policy] button on the right.
-
Enter “delete_after_1week” in ”Policy ID”.
-
The default policy is already entered, but you will not use it at this time. Copy and paste the following contents into “Define policy”. The below are simple statements. It is self-descriptive and you should be able to understand the content.
{ "policy": { "description": "Delete index 1 week after.", "default_state": "live", "states": [ { "name": "live", "actions": [ { "read_write": {} } ], "transitions": [ { "state_name": "delete", "conditions": { "min_index_age": "7d" } } ] }, { "name": "delete", "actions": [ { "delete": {} } ], "transitions": [] } ], "ism_template": { "index_patterns": ["workshop-log-*"] } } } -
Click [Create] button to create the policy.
Apply Index policy to an existing index
Because the policy specifying the index pattern has been defined after the index has been created, you need to manually apply the policy to the index.
- Choose “Indices” in the left menu. From the list of index, choose the index sucn as [workshop-log-2020-04-01-09] (the date part contains different values depending on the time of the workshop.), check the check box on the left, and then click [Apply policy] button on the top left.
- When the pop-up menu is displayed, choose “delete_after_1week” you have created, and click [Apply] button.
- You can see the policy is applied to the index when choosing [Managed Indices] on the left menu.
Summary
In Lab 3, you have completed to try out various features involving managing Amazon ES operations. Now, you know that you can easily manage many features. Let’s move onto to the next Lab, and learn more advanced features of Amazon ES.